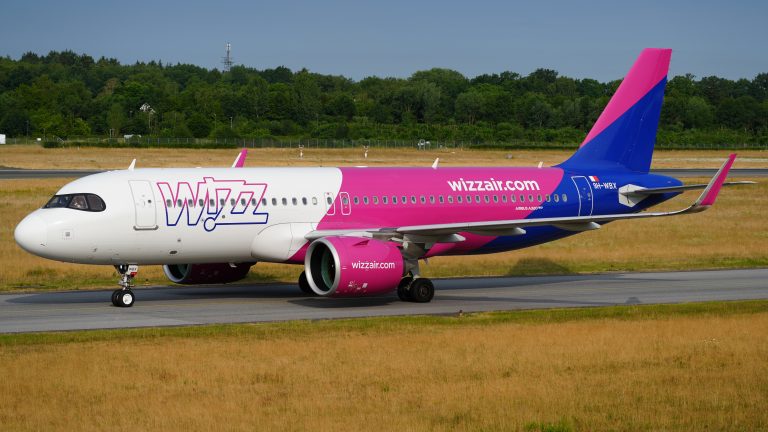
Wizz Air Holdings Plc (LON:WIZZ), one of the most sustainable European airlines, has announced passenger and CO2 emission statistics for March 2025.
Wizz Air carried 5.1 million passengers during the month of March, a 6.4% increase year on year. Seat capacity was up 6.7% YoY, resulting in a load factor of 90.5%, down 0.3 ppts on last year’s load factor of 90.8%.
During the month:
· March load factor remained steady YoY, despite both a return to capacity growth and Easter moving from March to April.
· A strong start to Q1 F26, with April fares up in the mid-to-high teens YoY due to Easter falling entirely in April.
· Summer bookings look encouraging, with load factors currently 2-3 ppts higher than this time last year in the core summer months.
· Wizz Air continues to be a leader in reducing emissions, reporting a further decrease in CO2 emissions per RPK in March, down 1.0% YoY, to 51.0 grams.
| Month | Rolling 12 months | |||||||||||
| March 2025 | March2024 | Change YoY | F25 | F24 | Change YoY | |||||||
| Capacity (seats) | 5,614,730 | 5,260,659 | 6.7% | 69,546,340 | 68,813,271 | 1.1% | ||||||
| Passengers* | 5,082,499 | 4,778,980 | 6.4% | 63,403,320 | 62,015,792 | 2.2% | ||||||
| Load Factor** | 90.5% | 90.8% | -0.3ppts | 91.2% | 90.1% | 1.0ppts | ||||||
*Booked passengers
**rounded to one decimal place
Wizz Air Monthly CO2 Emission Statistics
| Month | Rolling 12 months | |||||||||
| March 2025 | March 2024 | Change YoY | February 2025 | February 2024 | Change YoY | |||||
| CO2 (MT) emissions | 467,497 | 442,368 | 5.7% | 5,796,439 | 5,720,139 | 1.3% | ||||
| CO2 g per pax/km* | 51.0 | 51.5 | -1.0% | 52.2 | 52.0 | 0.3% | ||||


