Touchstone Exploration Inc. (TSX, LON:TXP) has provided an operational update and reports its operating and financial results for the three and nine months ended September 30, 2023.
Selected financial information is outlined below and should be read in conjunction with our September 30, 2023 unaudited interim condensed consolidated financial statements and related Management’s discussion and analysis, both of which will be available under our profile on SEDAR+ (www.sedarplus.ca) and on our website (www.touchstoneexploration.com). Unless otherwise stated, all financial amounts presented herein are rounded to thousands of United States dollars, and all production volumes disclosed herein are sales volumes based on Company working interest before royalty burdens.
Paul Baay, President and Chief Executive Officer, commented:
“The positive impact that initial output from our Cascadura field has had on both our production profile, and more importantly, our operating cash flows is clear. The results from the first few weeks of production at Cascadura demonstrate that we can look forward to materially enhanced operational and financial results.
While we are encouraged with our initial output levels, we are focused on optimizing production across our portfolio including Cascadura, Coho and our legacy oil properties. These operations are anticipated to be completed by the end of the year and will provide Touchstone with a strong platform upon which to continue our growth in 2024.
Along with our significant production gains, we continue to work to expand our land footprint and look forward to commencing our development drilling program on both the Ortoire block and our legacy acreage.“
Third Quarter 2023 and Recent Operational Highlights
· Achieved first production from the Cascadura-1ST1 well on September 6, 2023 and initial production from the Cascadura Deep-1 well on September 14, 2023.
· Produced record quarterly average volumes of 3,391 boe/d in the third quarter of 2023, representing a 167 percent increase relative to the 1,272 boe/d produced in the third quarter of 2022.
· Achieved average net sales volumes of 8,917 boe/d in October 2023, with the Cascadura field contributing 7,234 boe/d in the month.
· Cascadura wells are currently restricted by surface chokes while final facility commissioning progresses, with a production volume increase expected when the recycle compressor is operational.
· Coho-1 well workover is currently scheduled for late November 2023 to isolate water production from the lowest set of perforations.
· Preparations are underway at our Cascadura and CO-1 fields for future development drilling.
Third Quarter 2023 Financial Results Highlights
· Realized petroleum and natural gas sales of $11,682,000 compared to $9,933,000 in the 2022 comparative quarter, as $3,855,000 of incremental natural gas and NGL sales were partially offset by a $2,106,000 decrease in crude oil sales, reflecting a 15 percent decline in realized crude oil pricing and a 7 percent reduction in crude oil production.
· Cascadura field production volumes in the quarter contributed $1,871,000 of natural gas sales at an average realized price of $2.40/Mcf and $1,264,000 of NGL sales at an average realized price of $78.12/bbl.
· Natural gas production from the Coho-1 well averaged net volumes of 3.7 MMcf/d (618 boe/d) in the quarter and contributed $720,000 of net natural gas sales at an average realized price of $2.11/Mcf.
· Generated an operating netback of $6,011,000, representing a 37 percent increase from the 2022 third quarter primarily reflecting incremental Cascadura natural gas and NGL production volumes.
· Reported funds flow from operations of $2,432,000 in the third quarter of 2023 compared to $6,000 in the preceding quarter and $256,000 in the prior year equivalent quarter.
· Recognized net earnings of $988,000 and comprehensive income of $809,000 in the quarter compared to a net loss of $778,000 and a comprehensive loss of $1,228,000 reported in the third quarter of 2022.
· $3,609,000 in quarterly capital investments primarily focused on expenditures related to the construction and commissioning of the Cascadura natural gas and liquids facility and three Royston-1X well production tests.
· Exited the quarter with a cash balance of $3,794,000, a bank debt principal balance of $29,500,000 and a net debt position of $29,919,000.
· October 31, 2023 estimated cash balance of approximately $5.4 million.
Operational Update
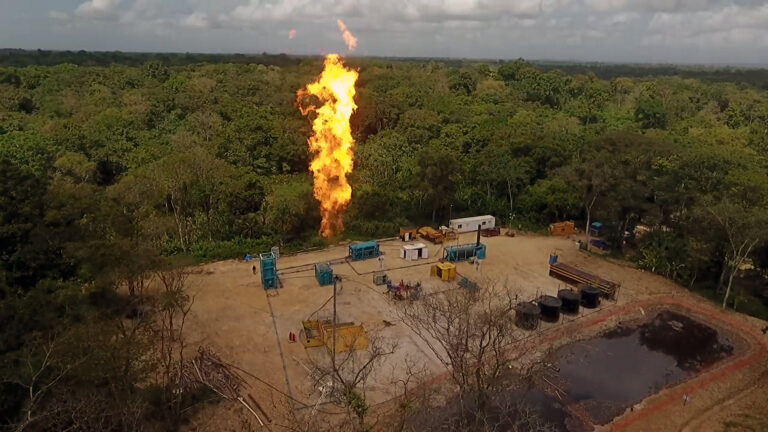
Touchstone Exploration commenced production from the Cascadura facility in September 2023, with the Cascadura-1ST1 well and the Cascadura Deep-1 well coming onstream on September 6, 2023 and September 14, 2023, respectively. Both wells are currently restricted by surface chokes while we proceed with final commissioning of the facility. The facility is designed as a closed system where vent gas from both the condensate flash separator and the vapours off the condensate storage tanks are captured, compressed, and reinjected into the system for sales, resulting in minimal emissions. The recycle compressor is currently non-operational resulting in vented production volumes being flared at the facility. Once the compressor is operational, we will be able to optimize the facility and we expect to see an increase in production volumes.
Our Coho facility has been operational for over a year and has produced approximately 2.26 billion cubic feet of gross natural gas volumes through October 2023. The Coho-1 well had a workover completed in October 2023 which was designed to isolate and shut off water production from the lowest perforations in the well. The workover was unsuccessful as the packer collapsed after the well commenced dry natural gas production. We have sourced a second packer which is currently scheduled to be installed prior to the end of November 2023, with the well continuing to produce until we commence the workover.
In October 2023, we achieved average net sales volumes of 8,917 boe/d as follows:
· Cascadura field contributed net sales volumes of 7,234 boe/d (9,042 boe/d gross) consisting of:
– net natural gas sales volumes of 38.7 MMcf/d or 6,456 boe/d (48.4 MMcf/d or 8,069 boe/d gross) with a realized price of $2.43/Mcf; and
– net natural gas liquids volumes of 778 bbls/d (973 bbls/d gross) with an average realized price of $77.18 per barrel.
· Net average natural gas sales volumes from Coho were 3.1 MMcf/d or 519 boe/d (3.9 MMcf/d or 649 boe/d gross) at a realized price of $2.15/Mcf.
· Average gross and net daily crude oil sales volumes were 1,164 bbls/d with an average realized price of $77.18 per barrel.
Touchstone has designed a work program for the Royston-1X well that will isolate and evaluate the two uppermost zones in the wellbore and expects to commence testing prior to the end of the year.
The Company is preparing to commence development drilling on our Cascadura and CO-1 fields. At Cascadura, the third-party drilling company is on site to obtain the required drilling rig certifications. At CO-1, we plan to drill two development wells off an existing surface lease and have contracted a Trinidad based drilling company to perform these operations. The rig is currently undergoing certifications to drill a well for another party and once complete it will be mobilized to our lease site, where we expect to drill the two CO-1 prospects in the first quarter of 2024.
Financial and Operating Results Summary
| Three months ended September 30, | % change | Nine months endedSeptember 30, | % change | |||
| 2023 | 2022 | 2023 | 2022 | |||
| Operational | ||||||
| Average daily production | ||||||
| Crude oil(1) (bbls/d) | 1,183 | 1,272 | (7) | 1,197 | 1,362 | (12) |
| NGLs(1) (bbls/d) | 176 | – | n/a | 59 | – | n/a |
| Crude oil and liquids (bbls/d) | 1,359 | 1,272 | 7 | 1,256 | 1,362 | (8) |
| Natural gas(1) (Mcf/d) | 12,191 | – | n/a | 7,203 | – | n/a |
| Average daily production (boe/d)(2) | 3,391 | 1,272 | 167 | 2,457 | 1,362 | 80 |
| Average realized prices(3) | ||||||
| Crude oil(1) ($/bbl) | 71.89 | 84.85 | (15) | 66.38 | 88.80 | (25) |
| NGLs(1) ($/bbl) | 78.12 | – | n/a | 78.12 | – | n/a |
| Crude oil and liquids ($/bbl) | 72.69 | 84.85 | (14) | 66.94 | 88.80 | (25) |
| Natural gas(1) ($/Mcf) | 2.31 | – | n/a | 2.23 | – | n/a |
| Realized commodity price ($/boe)(2) | 37.44 | 84.85 | (56) | 40.76 | 88.80 | (54) |
| Production mix (% of production) | ||||||
| Crude oil and liquids | 40 | 100 | 51 | 100 | ||
| Natural gas | 60 | – | 49 | – | ||
| Operating netback ($/boe)(2) | ||||||
| Realized commodity price(3) | 37.44 | 84.85 | (56) | 40.76 | 88.80 | (54) |
| Royalties(3) | (10.23) | (29.14) | (65) | (11.70) | (30.97) | (62) |
| Operating expenses(3) | (7.94) | (18.16) | (56) | (10.44) | (17.60) | (41) |
| Operating netback(3) | 19.27 | 37.55 | (49) | 18.62 | 40.23 | (54) |
| Financial | ||||||
| ($000’s except per share amounts) | ||||||
| Petroleum and natural gas sales | 11,682 | 9,933 | 18 | 27,339 | 33,025 | (17) |
| Cash from operating activities | 343 | 3,058 | (89) | 4,231 | 6,941 | (39) |
| Funds flow from operations | 2,432 | 256 | 850 | 3,241 | 2,849 | 14 |
| Net earnings (loss) | 988 | (778) | n/a | 638 | (1,276) | n/a |
| Per share – basic and diluted | 0.00 | (0.00) | n/a | 0.00 | (0.01) | n/a |
| Exploration capital expenditures | 3,498 | 2,692 | 30 | 17,043 | 7,498 | 127 |
| Development capital expenditures | 111 | 207 | (46) | 720 | 1,323 | (46) |
| Capital expenditures(3) | 3,609 | 2,899 | 24 | 17,763 | 8,821 | 101 |
| Working capital deficit(3) | 13,419 | 4,537 | 196 | |||
| Principal long-term bank debt | 16,500 | 22,500 | (27) | |||
| Net debt(3) – end of period | 29,919 | 27,037 | 11 | |||
| Share Information (000’s) | ||||||
| Weighted avg. shares outstanding: | ||||||
| Basic | 233,541 | 212,647 | 10 | 233,243 | 211,898 | 10 |
| Diluted | 237,138 | 212,647 | 12 | 236,947 | 211,898 | 12 |
| Outstanding shares – end of period | 234,213 | 213,113 | 10 | |||
Notes:
(1) In the table above and elsewhere in this announcement, references to “crude oil” refer to “light and medium crude oil” and “heavy crude oil” product types combined; references to “NGLs” refer to condensate; and references to “natural gas” refer to “conventional natural gas”, all as defined in National Instrument 51-101 Standards of Disclosure for Oil and Gas Activities (“NI 51-101”). Refer to the “Advisories – Product Type Disclosures” for further information.
(2) In the table above and elsewhere in this announcement, references to “boe” mean barrels of oil equivalent that are calculated using the energy equivalent conversion method. Refer to the “Advisories – Oil and Natural Gas Measures” for further information.
(3) Non-GAAP financial measure. See the “Advisories – Non-GAAP Financial Measures” for further information.
Touchstone Exploration Inc.
Touchstone Exploration Inc. is a Calgary, Alberta based company engaged in the business of acquiring interests in petroleum and natural gas rights and the exploration, development, production and sale of petroleum and natural gas. Touchstone is currently active in onshore properties located in the Republic of Trinidad and Tobago. The Company’s common shares are traded on the Toronto Stock Exchange and the AIM market of the London Stock Exchange under the symbol “TXP”.


