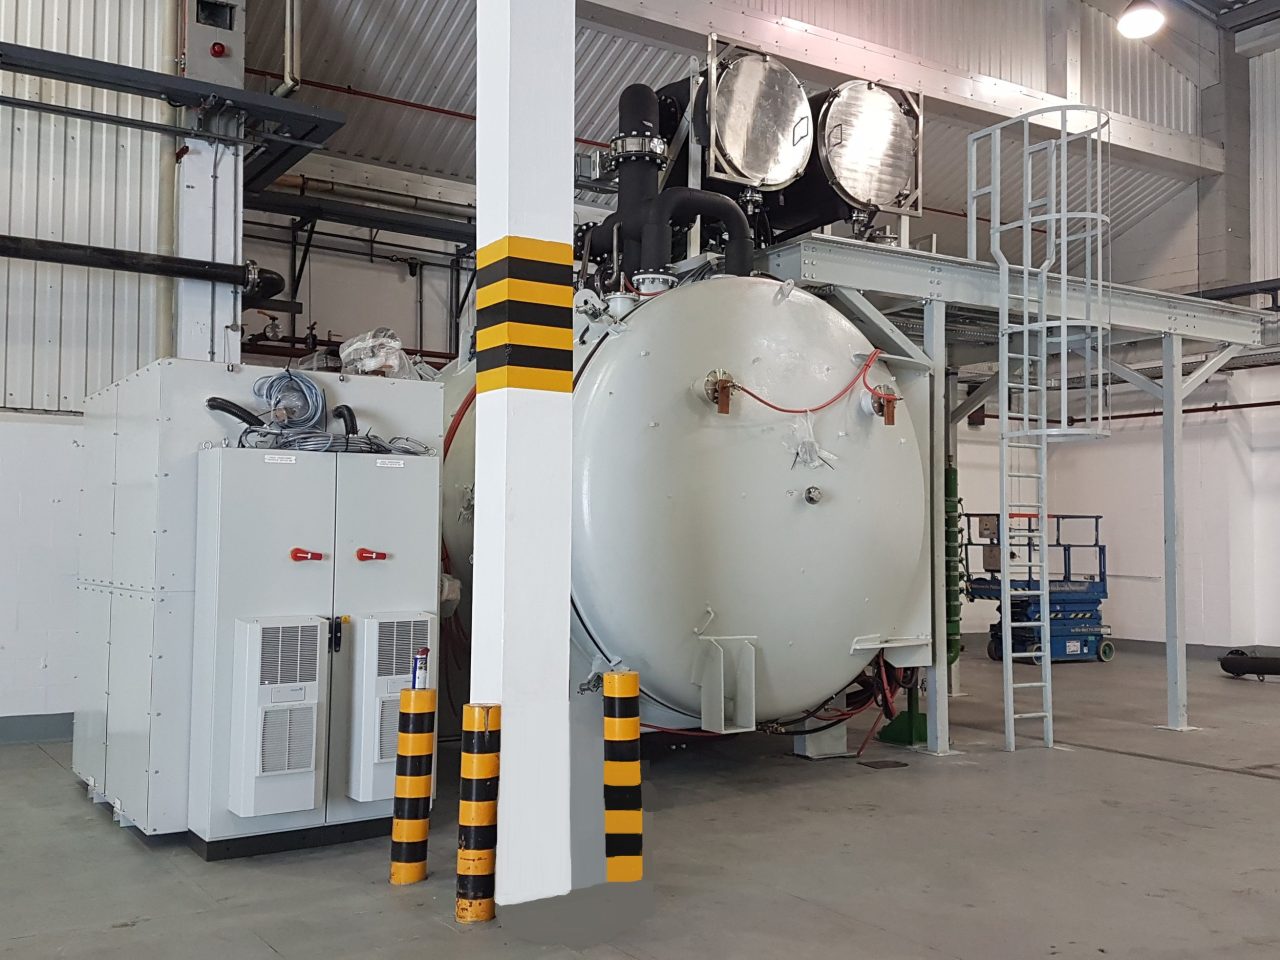
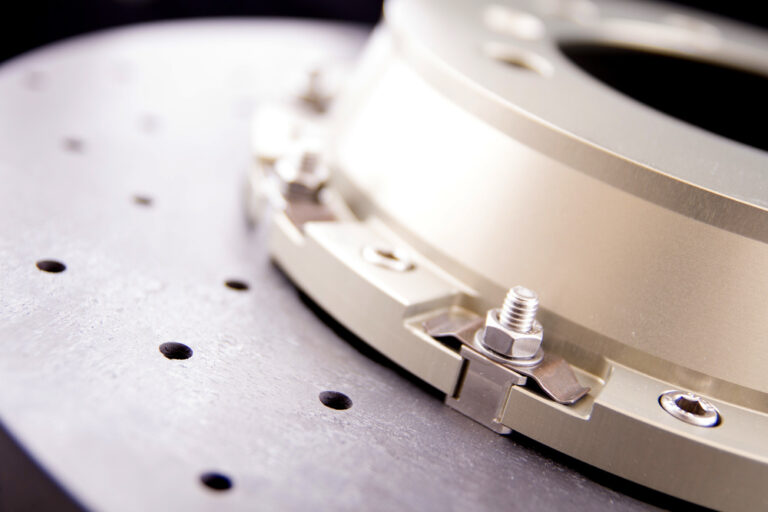
Surface Transforms plc (LON:SCE) has hosted a Capital Markets Day and site visit to its Knowsley, Merseyside, factory. We last visited about a year ago and the transformation is significant. The factory has been massively expanded and reorganised, with new equipment and processes configured for high volume continuous carbon ceramic brake disc production. The Group has had a highly successful few quarters, announcing a c.£100m contract with OEM 8, replacing a previous agreement worth £27.5m. Also, a £45m award was announced in December, with OEM 6. The total multi-year order bank now stands at c.£180m. Our estimates show revenue rising from £2.4m just reported for 2021a to £38m in 2025e, and with a pre-tax loss converting to £8.6m of PBT. Our assumptions include existing OEM contracts only – new wins and “carry-overs” are very likely. Costs are a concern everywhere, we assume significantly higher opex, capex and working capital outflows in 2022e to support more production volumes and offset inflationary pressures. But from about mid-2023e we should see a sharp acceleration of profit and operating cash inflows, reflecting high operational gearing and reducing unit costs. As with the scaling-up of any manufacturer there is execution risk, but the Group is well on-track to becoming a volume supplier to the OEMs. Our DCF-based valuation is 110p, indicating good potential upside.
Key takeaways from the Capital Markets Day and factory site visit:
Factory expansion and new manufacturing strategy – Over the past year Surface Transforms has installed major equipment (e.g., furnaces and CNC machines) and restructured factory processes with the aim of producing much higher volumes in a continuous (versus batch) process. Already the lead time to produce a finished brake disc has been reduced from nine months to one month. Through the remainder of this year, installation and commissioning of final equipment, and implementation of processes to support continuous production, will be completed.
Revenue opportunities – In part, Surface Transforms is meeting existing demand – from OEMs who have already adopted carbon ceramic technology for performance, weight, and environmental reasons, and who wish to have dual supply. But also, the Group is driving wider market adoption by providing a superior product and, ultimately, targeting a lower pricing point. As we have discussed previously, we calculate the current market size at c.£300m globally p.a. but potentially rising to multiple billions, with a focus on fitting carbon ceramic discs on higher priced vehicle models which have not yet converted from iron rotors.
Cost pressures and margins – We believe our assumptions on gross and net margins are prudent and reflect potential cost pressures from accelerated hiring of employees across the business, and higher materials and energy usage. Surface Transforms has several cost efficiency plans in place which will help mitigate current pressures. Margins should also naturally start to benefit from economies of scale, as production ramps up.
Refreshed Board – Ian Cleminson (Executive Vice President and CFO of NASDAQ-listed Innospec – IOSP) has just been appointed independent NED. The Group now has three high profile, experienced, newish, or new NEDs: alongside the existing senior team. Governance structures and experience levels are now more appropriate for the next phase of growth.
Zeus valuation – We use DCF modelling to assess a valuation for Surface Transforms. Our approach is prudent on input costs, working capital, capex requirements and the discount rate applied. Our valuation is 110p, approximately double the current share price.
Summary financials
| Price | 53.5p |
| Market Cap | £104m |
| Shares in issue | 195m |
| 12m Trading Range | 36p–77p |
| Free float | 100% |
| Next Event | Interims – September (est.) |
Financial forecasts
| Dec. y/e (£m) | 2021a | 2022e | 2023e | 2024e |
| Revenue | 2.4 | 14 | 20 | 30 |
| Adj. PBT | -4.4 | 0 | 1 | 5.9 |
| EPS (p) dil. | -2.1 | 0.4 | 0.9 | 2.5 |
| DPS (p) | – | – | – | – |
| Net cash/(debt) | 11.2 | 0 | -1.5 | 3.2 |
| P/E, x | -24.5 | – | 61.7 | 21.8 |
| EV/Sales, x | 37.3 | 7.5 | 5.3 | 3.4 |
| EV/EBITDA, x | -24.6 | – | 29.4 | 12 |
Source: Company data, Zeus estimates


