Shaftesbury PLC (LON:SHB), the Real Estate Investment Trust that owns a 15.1 acre portfolio in the heart of London’s West End, today announces its results for the six months ended 31 March 2019.
Financial Highlights – resilient performance
Resilient performance demonstrates both the exceptional qualities of our portfolio, located in the heart of London’s West End, and our proven long-term strategy:
§ Net property income up 5.2% to £48.6m (31.3.2018: £46.2m) following a 6.4% like-for-like increase in rents receivable
§ EPRA earnings1: £27.3m, +9.2% (31.3.2018: £25.0m)
§ Combined portfolio valuation growth1,2: +0.3% (6 months); +1.1% (12 months)
§ Profit after tax: £38.7m (31.3.2018: £123.7m). Decrease due to a lower combined net revaluation surplus in the current period
§ EPRA NAV1: £9.95, +0.4% (30.9.2018: £9.91)
§ Interim dividend: 8.7p, +4.8% (31.3.2018: 8.3p)
Operational highlights – robust demand and high level of activity
§ Robust occupier demand and consumer spending across our locations
§ Central Cross now 87% let or under offer
§ High level of value-enhancing projects continues. Schemes underway extending to 184,000 sq. ft., with an Estimated Rental Value (ERV) of £13.7m (9.3% of portfolio ERV)
§ Leasing activity continues to grow income, rental values and EPRA earnings:
- Commercial lettings and rent reviews concluded 2.0% above ERV at September 2018, and 6.0% over ERV at March 2018
- L-f-L ERV growth in wholly-owned portfolio: 2.1% (6 months); 3.2% (12 months)
- Wholly-owned portfolio reversionary potential: £30.6m, 26.4% over annualised current income
- Vacancy remains low, in line with long-term average
Brian Bickell, Chief Executive, commented:
“The resilient performance over the period demonstrates both the exceptional qualities of our portfolio, located in the heart of London’s West End, and our proven long-term strategy. We continue to deliver increases in current and potential rental income, which have underpinned growth in our earnings and dividends, and the stability of our net asset value.
Whilst macro uncertainties are likely to dominate the national mood for some time to come, we believe the medium to long-term outlook for London and the West End remains strongly positive, driven by their international appeal, broad economic base and dynamism.
With our unique portfolio, and a team which brings expertise, enterprise and innovation to managing our holdings, we are well-placed both to respond to short-term challenges and to benefit from London’s long-established status as a truly global city destination for businesses and visitors.”
| Six months ended | ||||
| Statement of Comprehensive Income | 31.3.2019 | 31.3.2018 | Change | |
| Reported results | ||||
| Net property income | £m | 48.6 | 46.2 | 5.2% |
| Profit after tax | £m | 38.7 | 123.7 | (68.7)% |
| Basic earnings per share | Pence | 12.6 | 41.7 | (69.8)% |
| Interim dividend per share | Pence | 8.7 | 8.3 | 4.8% |
| EPRA results1 | ||||
| Earnings | £m | 27.3 | 25.0 | 9.2% |
| Earnings per share | Pence | 8.9 | 8.4 | 6.0% |
Dividend fully covered by EPRA earnings per share.
| Balance Sheet | 31.3.2019 | 30.9.2018 | Change | |
| Reported | ||||
| Net assets | £m | 3,046 | 3,033 | 0.4% |
| Net asset value per share1 | £ | 9.91 | 9.87 | 0.4% |
| EPRA1 | ||||
| Net asset value per share | £ | 9.95 | 9.91 | 0.4% |
| NAV return | ||||
| – 6 months | % | 1.3% | 5.8% | |
| – 12 months | % | 2.9% | 9.0% |
Demand and occupancy
§ Leasing transactions completed with a rental value of £16.6 million (six months ended 31.3.2018: £15.3 million). Commercial lettings, lease renewals and rent reviews (rental value: £13.0 million) concluded at an average 2.0% above 30 September 2018 ERV and 6.0% above ERV at 31 March 2018.
§ EPRA vacancy down 1.3% to 3.3% (30.9.2018: 4.6%), of which 1.4% was under offer at 31 March 2019.
Central Cross
§ Now 87% let or under offer. Two shops and the final restaurant let in the period. Of the final three available retail units, two are now under offer.
Portfolio valuation
§ Combined valuation1, including our share of Longmartin joint venture: £3.98 billion. Valuation growth1,2: +0.3% (6 months); +1.1% (12 months).
§ Wholly-owned portfolio:
- Valuation: £3.76 billion; valuation growth1,2: 0.5% (6 months), 1.6% (12 months)
- Current annualised income: £116.0 million (30.9.2018: £113.4 million). Like-for-like growth: +2.1% (6 months). Twelve month growth2,5: +4.0%. 10-year CAGR2: 4.5%.
- ERV increased by £2.9 million to £146.6 million (30.9.2018: £143.7 million). Like-for-like growth: +2.1% (6 months); +3.2% (12 months). CAGR2 over 10 years: 4.6%.
- Portfolio reversionary potential: £30.6 million, 26.4% above current annualised income, of which £13.7 million relates to refurbishment schemes underway at 31 March 2019.
- Equivalent yield: 3.42% (30.9.2018: 3.41%).
§ Longmartin joint venture:
- Valuation3: £217.9 million. Valuation decline1: -4.0% (6 months); -4.6% (12 months).
- ERV decline2: 1.7% due to decrease in Long Acre retail ERVs. Non-retail ERV broadly unchanged.
- Equivalent yield: 3.86% (30.9.2018: 3.82%).
Portfolio investment
§ Redevelopment and refurbishment schemes during the period across 176,000 sq. ft.. Capital expenditure: £13.5 million.
- Space extending to 184,000 sq. ft. (9.3% of portfolio ERV) held for, or under, refurbishment at 31 March 2019.
- Projects with an ERV of £1.8 million completed in the period. New schemes with an ERV of £3.0 million commenced.
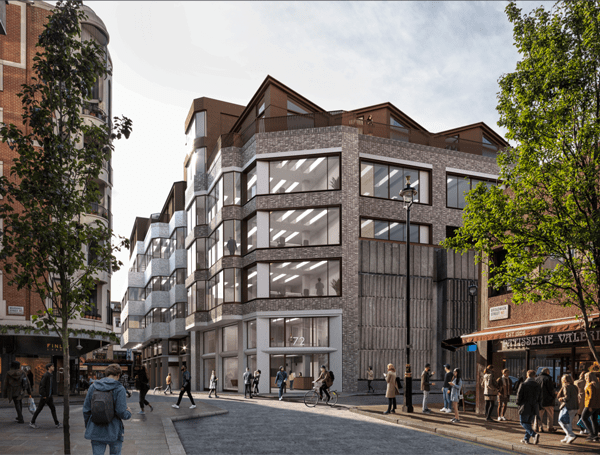
- 72 Broadwick Street: planning application submitted. Subject to consent, works expected to start in late summer 2019.
§ Capital expenditure3 in the Longmartin joint venture: £2.2 million, predominantly across two schemes.
§ Acquisitions: £12.1 million. Disposals: £14.3 million (net of sales costs), 24.3% above book value.
§ Forward purchase of 90-104 Berwick Street, for £41 million (incl. costs) now unlikely to complete before December 2019, following notification from the vendor of a further delay to its redevelopment scheme.
Financing
§ LTV1,4: 22.8% (30.9.2018: 22.8%), pro forma 24.5% on completion of current purchase and capital expenditure commitments.
§ Weighted average maturity of debt: 9.7 years (30.9.2018: 10.2 years).
§ Blended cost of debt1: 3.2% (30.9.2018: 3.2%). Marginal cost of unutilised facilities: 1.7%.


