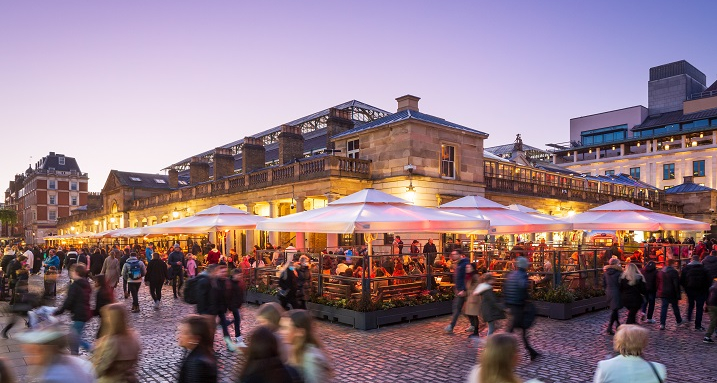
Shaftesbury PLC (LON:SHB), the Real Estate Investment Trust that owns a 15-acre portfolio in the heart of London’s West End, today announced its results for the year ended 30 September 2018.
Highlights
§ The West End’s global appeal and resilient, broad-based economy provide considerable insulation from headwinds affecting the national economy and consumer confidence
§ Robust trading, footfall and occupier demand across our locations. Continuing rental growth and low vacancy
§ 84.4% of income from our three larger schemes now contracted or under offer. Uncontracted income now just 1.3% of portfolio ERV1
§ Relentless management activity, strong growth in contracted income and reduced finance costs delivering increased EPRA earnings2
§ EPRA earnings2: £51.7m, an increase of 14.4%. Profit after tax: £175.5m (2017: £301.6m), following a revaluation surplus, this year, of £123.1m (2017: £230.6m)
§ Total dividend increased by 5.0% to 16.8p (2017: 16.0p). Total distribution for the year: £51.6m (2017: £47.1m), +9.6%
§ EPRA NAV2: £9.91 (2017: £9.52), 4.1% increase, driven by portfolio valuation growth2,3,4 of 3.8%
§ Portfolio investment1: £193.1m. Acquisitions: £167.8m and capital expenditure of £25.3m on schemes across 177,200 sq. ft.
§ ERV of space held for, or under refurbishment at 30 September 2018: £10.9m
§ Well positioned to continue to deliver on consistent and long-term proven strategy
Brian Bickell, Chief Executive, commented:
“It has been another year of good progress with growth in income, earnings and the value of our portfolio. Our results continue to demonstrate the appeal and qualities of our carefully-curated and iconic destinations, underwritten by the global attraction and exceptional features of London and the West End. Footfall and spending in our locations continues to be largely unaffected by the widely-reported headwinds affecting the national economy and consumer confidence.
General demand continues to be firm, buoyed by the trading conditions our tenants are reporting. Importantly, our ownership clusters enable us to curate distinctive locations and we continue to focus on growing their appeal by offering an ever-evolving experience with a variety of affordable, contemporary retail, restaurant and leisure choices. This approach supports the prosperity of our tenants and sustains demand for the competitively-priced commercial and residential accommodation we offer.
Our experienced, enthusiastic team, which brings flair and innovation to the management of our portfolio, coupled with secure finances and underpinned by the dynamism of, and prospects for, London and the West End, will continue to be the foundations of the long-term success of this exceptional business.”
|
Statement of Comprehensive Income |
2018 |
2017 |
Change |
|
|
Reported results |
||||
|
Net property income |
£m |
93.8 |
88.3 |
+6.2% |
|
Profit after tax |
£m |
175.5 |
301.6 |
-41.8% |
|
Basic earnings per share |
Pence |
58.1 |
108.1 |
-46.3% |
|
Final dividend per share |
Pence |
8.5 |
8.1 |
+4.9% |
|
Total dividends for the year |
Pence |
16.8 |
16.0 |
+5.0% |
|
Total distribution for the year |
£m |
51.6 |
47.1 |
+9.6% |
|
EPRA results2 |
||||
|
Earnings |
£m |
51.7 |
45.2 |
+14.4% |
|
Earnings per share |
Pence |
17.1 |
16.2 |
+5.6% |
|
Balance Sheet |
2018 |
2017 |
Change |
|
|
Reported |
||||
|
Net assets |
£m |
3,033 |
2,647 |
+14.6% |
|
Net asset value per share2 |
£ |
9.87 |
9.49 |
+4.0% |
|
EPRA2 |
||||
|
Net assets |
£m |
3,050 |
2,665 |
+14.4% |
|
Net asset value per share |
£ |
9.91 |
9.52 |
+4.1% |
|
NAV return |
% |
5.8% |
8.9% |
Robust occupier demand. Good letting progress at larger schemes
§ Leasing transactions1 with a rental value of £31.4 million completed (2017: £31.1 million). Commercial lettings, lease renewals and rent reviews1 (rental value: £23.2 million) concluded at an average 5.1% above 30 September 2017 ERV.
§ At our three completed larger schemes, 84.4% of the income is now contracted or under offer. ERV of uncontracted space is now 1.3% of wholly-owned portfolio ERV.
§ Excluding larger schemes, EPRA vacancy1 at 30 September 2018: 2.7% of ERV (in line with 10-year average) of which 1.3% was under offer.
Continued growth in contracted rents, ERVs and portfolio value1
§ Total portfolio valuation2,3: £3.95 billion. Valuation growth2,3: +3.8% (2017: +7.0%).
§ Equivalent yields:
– Wholly-owned portfolio: 3.41% (2017: 3.46%);
– Longmartin joint venture: 3.82% (2017: 3.80%).
§ Current annualised income3: £121.5 million (2017: £114.1 million). Like-for-like growth: +5.1% (2017: 3.9%). 10-year CAGR4: 5.1%.
§ ERV3 increased by £9.5 million to £154.0 million (2017: £144.5 million). Like-for-like growth: 2.4% (2017: +3.5%). CAGR4 over 10 years: 3.9%.
§ Portfolio reversionary potential3: £32.5 million, 26.7% above current annualised income, of which £11.8 million relates to refurbishment schemes in progress at 30 September 2018.
Further investment in our portfolio
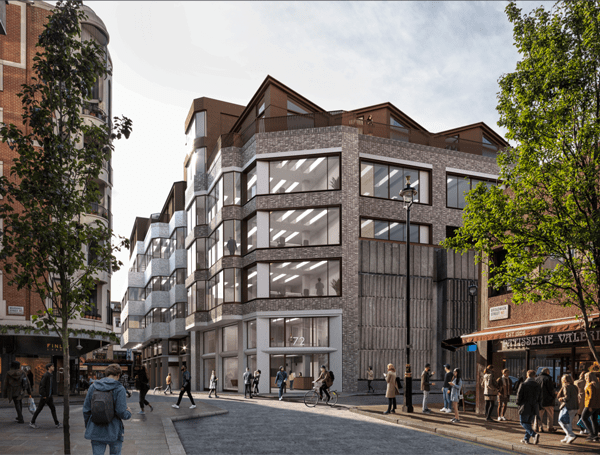
§ Acquisitions: £167.8 million, including the freehold of 72 Broadwick Street, Carnaby, six buildings in Neal Street, Seven Dials and 35/36 Great Marlborough Street, Carnaby. Other acquisitions in Carnaby, Covent Garden, Chinatown and Soho.
§ Strategic forward-purchase of 90-104 Berwick Street, for £41 million (incl. costs) now expected to complete in mid- 2019, as a result of delayed completion of the vendor’s redevelopment scheme.
§ Redevelopment and refurbishment schemes1 during the period across 177,200 sq. ft. (9.7% of floor space). Capital expenditure1: £25.3 million. Our share of capital expenditure in the Longmartin joint venture: £2.4 million.
– Projects with an ERV of £8.1 million completed in the period. New schemes (ERV: £10.0 million) commenced.
– 174,700 sq. ft. (representing 7.6% of ERV6) being held for, or under, refurbishment at 30 September 2018.
– Secured vacant possession of 65,300 sq. ft. of space at 72 Broadwick Street. Planning application to be submitted shortly. Works expected to start in summer 2019.
– Continuing to identify further asset management initiatives across the portfolio to increase rental potential and unlock value.
§ Selective disposals of non-core assets: proceeds £13.3 million, £4.6 million above book value at 30 September 2017.
Financing arrangements to support growth and development of the business over the long term
§ Share placing in December 2017 at £9.52 per share raised £260.4 million (net of expenses).
§ Revolving credit facilities extended and refinanced. Earliest maturity 2022.
§ Cash and available debt resources: £343.5 million, of which £92.7 million already earmarked for investment.
§ Group LTV2,3,5: 22.8% (2017: 26.7%).
§ Weighted average maturity of debt3: 10.2 years (2017: 10.3 years).
§ Blended cost of debt2,3: 3.2% (2017: 3.3%). Marginal cost on unutilised facilities: 1.6%.


