
Pantheon International Plc (LON:PIN) has announced its Performance Update at 28 February 2025.
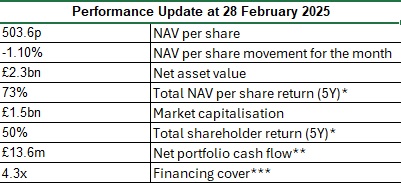
Performance Update at 28 February 2025
Month to 28 February 2025
Pantheon International announced an unaudited net asset value (NAV) per share of 503.6p as at 28 February 2025, a decrease of -5.7p (-1.1%) from the NAV per share as at 31 January 2025.
In the month to 28 February 2025, valuation gains** were +1.1p (+0.2%), investment income** added +0.3p (+0.1%), foreign exchange movements** were -6.4p (-1.2%), share buybacks added +0.1p (+0.0%) and expenses and taxes**** were -0.8p (-0.2%).
PIP’s valuation policy for private equity funds is based on the latest valuations reported by the managers of the funds in which PIP has holdings. In the case of PIP’s valuation as at 28 February 2025, 6% of reported valuations are dated 28 February 2025 or later, 38% are dated 31 December 2024, 54% are dated 30 September 2024 and 2% are dated 30 June 2024. Of the 6% of valuations dated 28 February 2025 or later, 5.1% reflect the mark-to-market fair value adjustment for PIP’s listed company holdings.
At 28 February 2025, PIP’s private equity assets stood at £2,512m, whilst net available cash balances^ were £27m. The Asset Linked Note^^ (“ALN”) outstanding as at 28 February 2025 amounted to £25m. Undrawn commitments to investments stood at £720m as at 28 February 2025, calculated using exchange rates at that date. PIP maintains a £400m^^^ multi-tranche, multi-currency revolving credit facility. As at 28 February 2025, £75m was drawn down under the credit facility and $150m (£119m GBP equivalent as at month end) of private placement notes were outstanding, resulting in a net debt to NAV ratio of 7.2%.^^^^
Net Portfolio Cash Flow
PIP received distributions of £16.7m relative to £3.1m of calls from existing commitments to private equity funds. Therefore, PIP’s portfolio generated net cash of £13.6m during the month.
New Investments
Although the Company made no significant new commitments during the month, PIP’s pipeline points to an active period for new commitments in the months ahead.
Share Buybacks
PIP invested £1.1m in share buybacks during the month, acquiring 350,000 shares at a weighted average price of 321.1p per share. This price represented an average discount of 36.3% to the prevailing NAV per share at the time of the transactions. As at 28 February 2025, PIP has allocated a total of £15.0m for share buybacks in the current financial year, of which PIP has invested a total of £12.0m.
Nine months to 28 February 2025
Performance
The unaudited NAV per share of 503.6p as at 28 February 2025 is an increase of +13.1p (+2.7%) relative to the NAV per share as at 31 May 2024. Valuation gains* added +16.1p (+3.3%), investment income* added +3.3p (+0.7%), foreign exchange movements* were +0.6p (+0.1%), share buybacks added +1.8p (+0.4%) and expenses and taxes**** were -8.7p (-1.8%).
Portfolio Net Cash Flow
PIP received distributions of £223.8m relative to £115.2m of calls from existing commitments to private equity funds. Therefore, PIP’s portfolio generated net cash of £108.6m during the nine-month period.
New Commitments
PIP made 10 new investments during the nine months ended 28 February 2025, amounting to £88.0m in new commitments. These commitments were to five primary funds (£50.9m), two co-investments (£20.9m) and three manager-led secondaries (£16.2m).
PIP continued to make primary commitments, the timing of which is linked to the fundraising cycles of a targeted list of GPs.
Share Buybacks
During the nine months ended 28 February 2025, PIP invested £15.5m***** in share buybacks, acquiring 4,863,799 shares at a weighted average price of 319.0p per share. This price represented an average discount of 34.7% to the prevailing NAV per share at the time of the transactions.
Share buybacks during the period have resulted in a +0.4% uplift to the May 2024 NAV per share.
Capital Allocation
The adjusted net cash flow according to Pantheon International’s Capital Allocation Policy is calculated at the end of each quarter of PIP’s financial year. As at 28 February 2025, the share buyback allocation under the CAP should be between £4.1m and £7.9m. The PIP Board is committed to delivering for shareholders and remains confident in the valuations reported by our underlying private equity managers. Therefore, the Board has exercised its discretion and opted to allocate £35.0m to share buybacks, to be deployed by 31 May 2025. This brings the aggregate share buyback allocation for the financial year-to-date to £50m.
*Based on the change in the NAV per share and ordinary share price over the period.
**Figures are stated net of movements associated with the ALN share of the reference portfolio. Valuation movement includes the mark-to-market fair value adjustment of listed company holdings.
***Ratio of net available cash, portfolio value and undrawn credit facility to outstanding commitments. Outstanding commitments relating to funds outside their investment period (>13 years old) were excluded from the calculation as there is a low likelihood of these being drawn. This amounted to £45.6m as at 28 February 2025.
****Operating expenses, financing costs and withholding taxes on investment distributions.
*****Includes £3.5m of share repurchases that relate to the unused portion of the £200m FY2024 share buyback programme that was carried over to the current financial year.
^Net available cash calculated as cash and net current assets / (liabilities) less undistributed net cashflows associated with the ALN.
^^Unlisted 10-year note issued on 31 October 2017 whose cost and repayments are linked to a reference portfolio consisting of the Company’s older vintage funds.
^^^PIP maintains a £400m multi-currency credit facility. The overall credit facility comprises facilities of US$393.0m and €120.0m and had a sterling equivalent value of £411.2m as at 28 February 2025. As at 28 February 2025, PIP had drawn down £74.7m of the credit facility.
^^^^Net debt calculated as borrowings (excluding the outstanding balance of the Asset Linked Note) less net available cash. The ALN is not considered in the calculation of gross borrowings or the loan-to-value ratio, as defined in PIP’s credit facility and note agreements. If the ALN is included, net debt to NAV was 8.3% as at 28 February 2025.
Annualised Performance as at 28 February 2025^^^^^
| 1 Year(% p.a.) | 3 Years(% p.a.) | 5 Years(% p.a.) | 10 Years(% p.a.) | Since Inception(% p.a.) | |
| NAV per share | 4.1% | 6.4% | 11.6% | 12.8% | 11.7% |
| Ordinary share price | 3.2% | 2.5% | 8.5% | 9.5% | 10.7% |
| FTSE All-Share, TR | 18.4% | 8.5% | 8.9% | 6.2% | 7.6% |
| MSCI World TR, (£) | 16.7% | 13.1% | 14.8% | 12.7% | 8.8% |
^^^^^PIP was launched on 18 September 1987. The performance figures for PIP assume reinvestment of dividends and capital.
Discrete Performance as at 28 February 2025
| 29/02/2024- 28/02/2025 | 28/02/2023- 29/02/2024 | 28/02/2022- 28/02/2023 | 28/02/2021- 28/02/2022 | 29/02/2020- 28/02/2021 | |
| NAV per share | 4.1% | 4.4% | 11.0% | 32.4% | 8.5% |
| Ordinary share price | 3.2% | 20.3% | -13.1% | 24.6% | 11.8% |
| FTSE All-Share, TR | 18.4% | 0.6% | 7.3% | 16.0% | 3.5% |
| MSCI World TR, (£) | 16.7% | 20.2% | 3.2% | 15.9% | 18.8% |
Largest Holdings
Largest companies by value as at 30 November 2024
| Company | Country | Sector | % of portfolio |
| Kaseya | Switzerland | Information Technology | 1.3% |
| Visma | Norway | Information Technology | 1.2% |
| Action | Netherlands | Consumer | 1.2% |
| Smile Doctors | USA | Healthcare | 0.9% |
| John Staurulakis | USA | Industrials | 0.9% |
Largest managers by value as at 28 February 2025
| Manager | Region | % of portfolio |
| Insight Partners | USA | 6.5% |
| Index Ventures | Global | 4.1% |
| HgCapital | Europe | 3.8% |
| Providence Equity Partners | USA | 3.1% |
| Parthenon Capital | USA | 2.6% |
Foreign Exchange Exposure
At 28 February 2025, the value of the private equity investment assets stood at £2,512m. Of the private equity investment assets at PIP’s holding level, 76% were represented by funds reporting values denominated in US dollars, 19% denominated in euros, 4% denominated in sterling and 1% denominated in other currencies.
Of the 76% of investment assets denominated in US dollars, approximately 8% (expressed as a proportion of PIP’s total portfolio) are invested in funds investing mainly in Europe and approximately 6% (expressed as a proportion of PIP’s total portfolio) in funds investing mainly in Asia.
As at 28 February 2025, the GBP/USD exchange rate was 1.2592 and the GBP/EUR exchange rate was 1.2108.
Monthly Report


