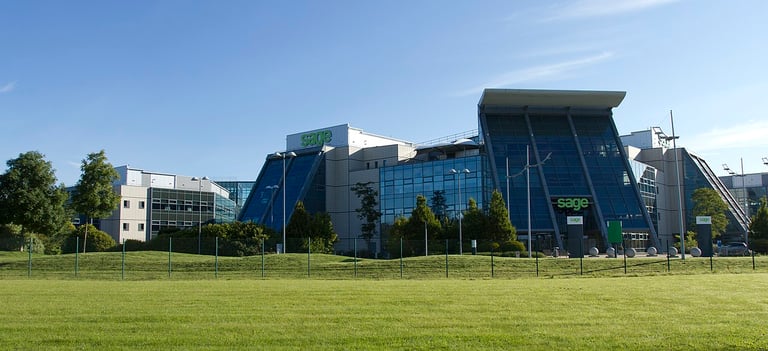
Shares of The Sage Group company symbol: LON:SGE has climbed 4.82% or 31.6 points throughout the session so far. Investors are a positive bunch throughout the trading session. The high for the period has reached 687 and hitting a low of 652.09. The amount of shares exchanged has so far reached 1,416,879 while the average shares exchanged is 3,857,197. A 52 week share price high is 826 some 171 points in difference on the previous days close and a 52 week low being 515.6 a difference of some 139.4 points. The Sage Group now has a 20 simple moving average of 635.19 and also a 50 day moving average at 624.38. Market capitalisation is now £7,481.41m at the time of this report. The stock is traded in GBX. Mcap is measured in GBP. This article was written with the last trade for The Sage Group being recorded at Wednesday, May 13, 2020 at 12:54:29 PM GMT with the stock price trading at 686.6 GBX.
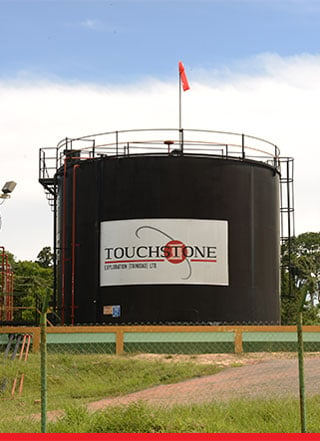
Shares of Touchstone Exploration Inc with company EPIC: LON:TXP has moved up 9.31% or 2.98 points in today’s trading session so far. Market buyers have remained optimistic throughout the trading session. The periods high has already touched 34.98 dipping to 31.44. The total volume of shares exchanged so far has reached 418,747 with the daily average traded share volume around 783,550. The stock 52 week high is 56.65 about 24.65 points difference from the previous close and the 52 week low at 9.8 a difference of some 22.2 points. Touchstone Exploration Inc now has a 20 moving average of 29.22 and now a 50 day moving average of 30.07. The current market cap is £102.75m at the time of this report. The share price is in GBX. Mcap is measured in GBP. This article was written with the last trade for Touchstone Exploration Inc being recorded at Wednesday, May 13, 2020 at 12:33:44 PM GMT with the stock price trading at 34.98 GBX.
Shares in Vodafone Group with EPIC code: LON:VOD has stepped up 2.26% or 2.78 points throughout the session so far. Buyers have stayed positive throughout the session. Range high for the period has seen 125.98 and a low of 121.06. The total volume of shares exchanged through this period comes to 27,697,110 whilst the daily average number of shares exchanged is just 91,157,319. The 52 week high for the shares is 169.46 around 46.58 points difference from the previous days close and the 52 week low at 92.76 a difference of some 30.12 points. Vodafone Group has a 20 SMA of 113.15 and now the 50 day simple moving average now at 117.27. The market cap now stands at £33,643.26m at the time of this report. Share price is traded in GBX. Mcap is measured in GBP. This article was written with the last trade for Vodafone Group being recorded at Wednesday, May 13, 2020 at 12:54:44 PM GMT with the stock price trading at 125.66 GBX.

