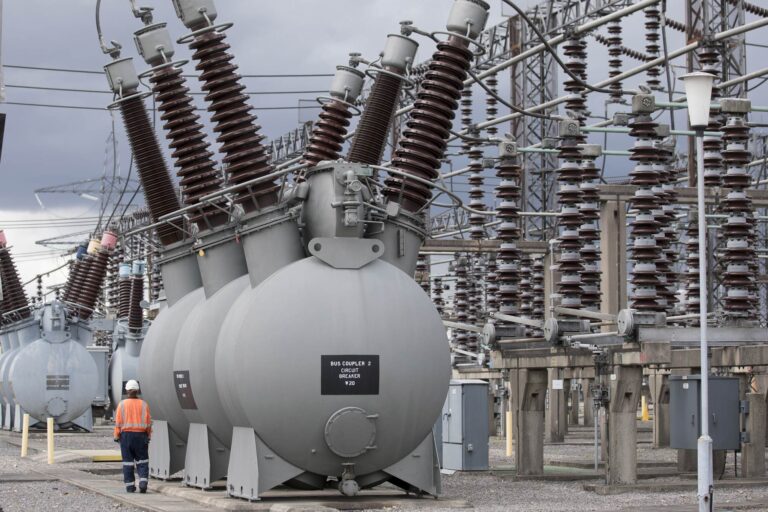
The stock price for National Grid plc company symbol: LON:NG has risen 1.12% or 9.3 points during the course of today’s session so far. Investors have so far held a positive outlook throughout the trading session. Range high for the period so far is 839.1 and a low of 821.7. The amount of shares exchanged has so far reached 923,487 with the average number of shares traded daily being 7,498,421. The 52 week high price for the shares is 892 around 63.5 points difference from the previous days close and putting the 52 week low at 744.5 a difference of some 84 points. National Grid plc now has a 20 moving average of 855.94 with a 50 day MA at 852.27. The current market cap is £29,159.31m at the time of this report. All share prices mentioned for this stock are traded in GBX. Mcap is measured in GBP. This article was written with the last trade for National Grid plc being recorded at Monday, September 16, 2019 at 11:42:47 AM GMT with the stock price trading at 837.8 GBX.
Stock in NEXT plc with EPIC code: LON:NXT has increased 1.35% or 82 points throughout the session so far. Buyers have remained optimistic throughout the trading session. The periods high has reached 6178 and hitting a low of 6036. The volume total for shares traded up to this point was 108,160 with the daily average at 489,485. The 52 week high is 6218 about 158 points difference from the previous close and the 52 week low at 3970 a difference of some 2090 points. NEXT plc has a 20 SMA of 5968.17 and now its 50 day moving average of 5825.15. The market capitalisation is now £8,182.92m at the time of this report. The currency for this stock is Great British pence.Market cap is measured in GBP. This article was written with the last trade for NEXT plc being recorded at Monday, September 16, 2019 at 11:42:33 AM GMT with the stock price trading at 6142 GBX.
Shares of Royal Dutch Shell Plc ticker lookup code: LON:RDSA has climbed 2.69% or 61.49 points throughout today’s trading session so far. Buyers seem confident throughout the session. The high for the period has peaked at 2362 dropping as low as 2337. Volume total for shares traded at this point reached 3,618,677 with the daily average traded share volume around 12,589,173. The 52 week high price for the shares is 2811.38 equating to 528.88 points in difference to the previous days close of business and a 52 week low sitting at 2209.5 making a difference of 73 points. Royal Dutch Shell Plc now has a 20 SMA of 2308.21 and a 50 day moving average now of 2432.01. The market capitalisation is now £210,031.63m at the time of this report. All share prices mentioned for this stock are traded in GBX. Mcap is measured in GBP. This article was written with the last trade for Royal Dutch Shell Plc being recorded at Monday, September 16, 2019 at 11:42:49 AM GMT with the stock price trading at 2343.99 GBX.


