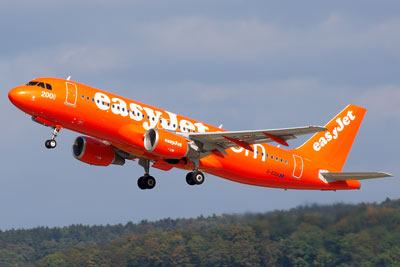
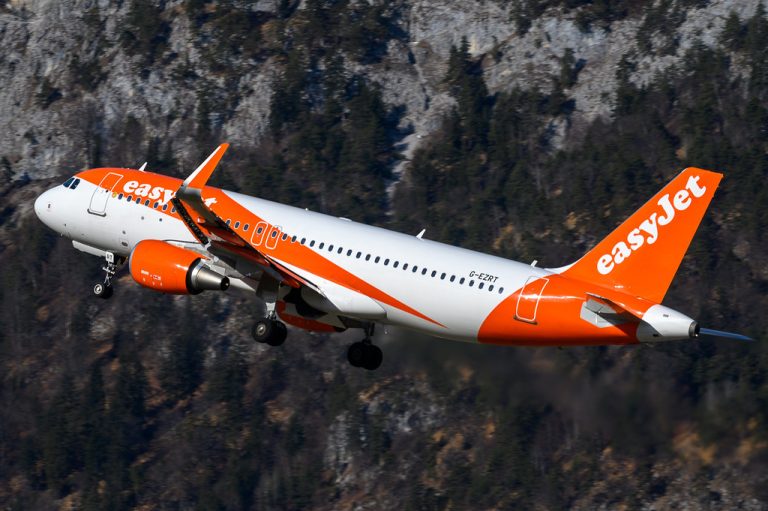
Shares of easyJet EPIC code: LON:EZJ has slid -2.88% or -24 points throughout the session so far. Traders have so far given a mostly negative outlook during the session. The periods high has already touched 819.41 dipping to 795.37. Volume total for shares traded at this point reached 1,056,841 whilst the daily average number of shares exchanged is just 4,277,076. The 52 week high for the shares is 1570 which is 738 points in difference on the previous days close and a 52 week low being 410 a difference of some 422 points. easyJet now has a 20 SMA at 830.22 and the 50 day moving average now at 832.16. The market cap now stands at £3,690.54m at the time of this report. The currency for this stock is Great British pence.Market cap is measured in GBP. This article was written with the last trade for easyJet being recorded at Monday, January 18, 2021 at 12:14:37 PM GMT with the stock price trading at 808 GBX.
The share price for Micro Focus International EPIC code: LON:MCRO has declined -2.79% or -11.92 points throughout the session so far. Sellers have not remained optimistic during this period. The high for the period has peaked at 425.9 while the low for the session was 414.6. The total volume of shares exchanged through this period comes to 145,104 while the average shares exchanged is 1,787,070. The 52 week high price for the shares is 1148 which comes in at 721.4 points in difference to the previous days close of business and a 52 week low sitting at 205.8 making a difference of 220.8 points. Micro Focus International has a 20 day moving average of 431.78 and now the 50 day moving average now of 398.77. This puts the market cap at £1,388.93m at the time of this report. The share price is in GBX. Mcap is measured in GBP. This article was written with the last trade for Micro Focus International being recorded at Monday, January 18, 2021 at 12:15:33 PM GMT with the stock price trading at 414.68 GBX.
Shares in Royal Dutch Shell Class B with ticker code: LON:RDSB has moved down -1.51% or -21.4 points in today’s trading session so far. Market sellers were far from a positive bunch during the session. The period high was 1410 dropping as low as 1379. The volume total for shares traded up to this point was 1,187,203 whilst the daily average number of shares exchanged is just 6,863,221. A 52 week high for the stock is 2282.5 around 862.5 points in difference on the previous days close and a 52 week low being 845.1 which is a variance of 574.9 points. Royal Dutch Shell Class B has a 20 day moving average of 1370.87 and now a 50 day SMA of 1315.38. The market capitalisation currently stands at £126,147.32m at the time of this report. The share price is in GBX. Mcap is measured in GBP. This article was written with the last trade for Royal Dutch Shell Class B being recorded at Monday, January 18, 2021 at 12:15:04 PM GMT with the stock price trading at 1398.6 GBX.


