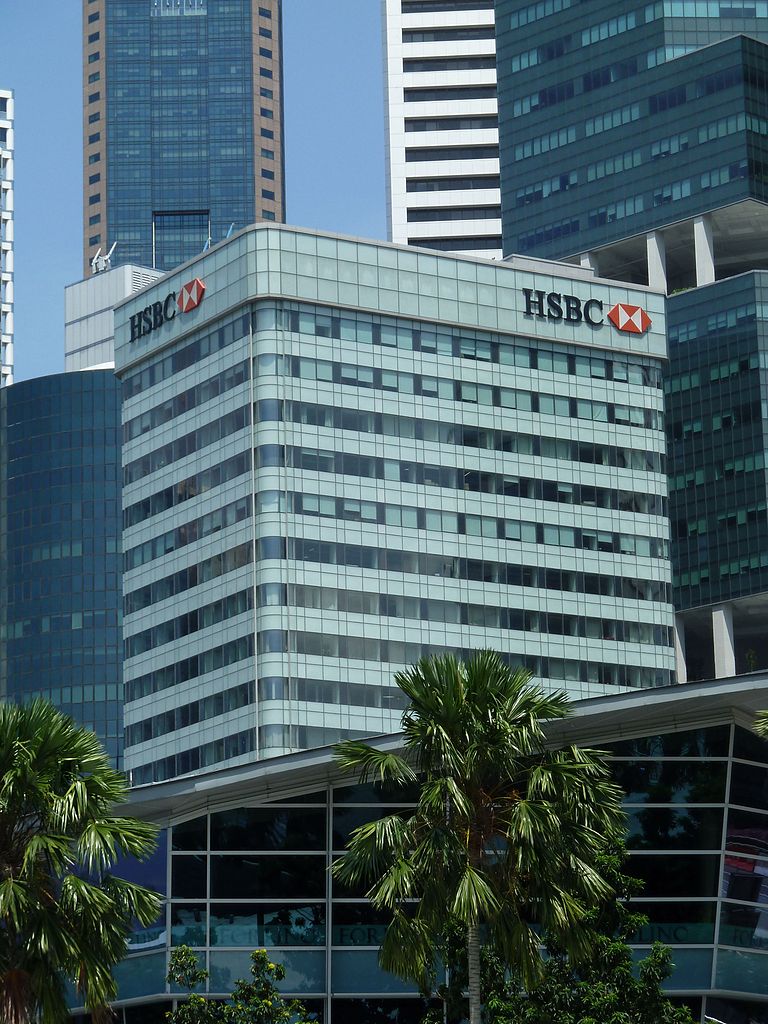
HSBC Holding Plc (LON:HSBA), today released Q3 2018 earnings.
Financial performance
• Reported profit before tax for 9M18 of $16.6bn was 12% higher than for 9M17, reflecting revenue growth in all of our global businesses, partly offset by higher operating expenses. Adjusted profit before tax of $18.3bn was 4% higher than for 9M17, excluding the effects of foreign currency translation differences and movements in significant items.
• Reported revenue for 9M18 of $41.1bn was 5% higher, notably driven by a rise in deposit revenue across our global businesses, primarily in Asia, as we benefited from wider margins and grew our balances. These increases were partly offset by lower revenue in Corporate Centre. Adjusted revenue of $41.4bn was 4% higher, excluding the effects of foreign currency translation differences and movements in significant items.
• Reported operating expenses for 9M18 of $25.5bn were 2% higher, primarily reflecting investments to grow the business and enhance our digital capabilities, and the effects of foreign currency translation differences, partly offset by a favourable movement in significant items. Adjusted operating expenses of $24.1bn were 6% higher, excluding the effects of foreign currency translation differences and movements in significant items.
• Adjusted jaws for 9M18 was negative 1.6%.
• Reported profit before tax for 3Q18 of $5.9bn was 28% higher than for 3Q17, reflecting strong revenue growth and lower operating expenses. Adjusted profit before tax of $6.2bn was 16% higher, excluding the effects of foreign currency translation differences and movements in significant items.
• Reported loans and advances to customers increased by $8.0bn during 3Q18. Excluding foreign currency translation differences, loans and advances grew by $14bn or 1% from 2Q18.
• Capital base remained strong with a common equity tier 1 (‘CET1’) ratio of 14.3% and a CRD IV leverage ratio of 5.4%.
John Flint, Group Chief Executive of HSBC Holdings, said:
“These are encouraging results that demonstrate the revenue potential of HSBC. We are doing what we said we would – delivering growth from areas of strength, and investing in the business while keeping a strong grip on costs. We remain committed to growing profits, generating value for shareholders and improving the service we offer our customers around the world.”
|
Financial highlights and key ratios |
||||||||||||
|
|
9 months ended 30 Sep |
Quarter ended 30 Sep |
||||||||||
|
|
2018 |
2017 |
Change |
2018 |
2017 |
Change |
||||||
|
|
$m |
$m |
% |
$m |
$m |
% |
||||||
|
Reported profit before tax |
16,634 |
|
14,863 |
|
12 |
|
5,922 |
|
4,620 |
|
28 |
|
|
Adjusted profit before tax |
18,332 |
|
17,698 |
|
4 |
|
6,193 |
|
5,332 |
|
16 |
|
|
|
% |
% |
% |
% |
% |
% |
||||||
|
Return on average ordinary shareholders’ equity (annualised) |
9.0 |
|
8.2 |
|
9.8 |
|
9.6 |
|
7.1 |
|
35.2 |
|
|
Return on average tangible equity (annualised)
|
10.1 |
|
9.3 |
|
8.6 |
|
10.9 |
|
8.2 |
|
32.9 |
|
|
Adjusted jaws |
(1.6 |
) |
|
|
|
|
|
|||||
We use adjusted performance to understand the underlying trends in the business. The main differences between reported and adjusted figures are foreign currency translation and significant items, which include litigation and regulatory items, offset by the non-recurrence of costs to achieve in 9M18.
|
Capital and balance sheet |
|||||||
|
|
|
At |
|||||
|
|
|
30 Sep |
30 Jun |
31 Dec |
|||
|
|
|
2018 |
2018 |
2017 |
|||
|
|
Footnotes |
% |
% |
% |
|||
|
Common equity tier 1 ratio |
1 |
14.3 |
|
14.2 |
|
14.5 |
|
|
Leverage ratio |
1 |
5.4 |
|
5.4 |
|
5.6 |
|
|
|
|
$m |
$m |
$m |
|||
|
Loans and advances to customers |
|
981,460 |
|
973,443 |
|
962,964 |
|
|
Customer accounts |
|
1,345,375 |
|
1,356,307 |
|
1,364,462 |
|
|
Risk-weighted assets |
1 |
862,652 |
|
865,467 |
|
871,337 |
|
1 Calculated using the EU’s regulatory transitional arrangements for IFRS 9 in article 473a of the Capital Requirements Regulation. Figures at 31 December 2017 are reported under IAS 39.


