What does ChatGPT say about SHIB/USDT trading pair?
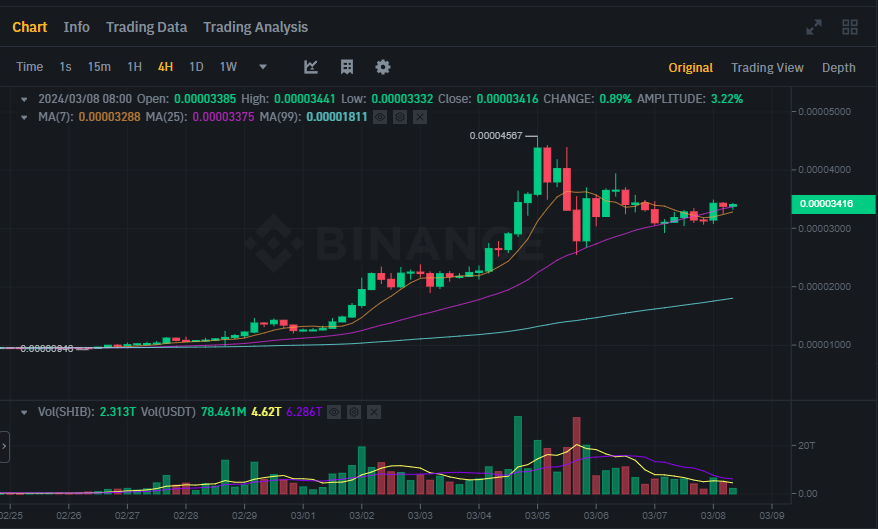
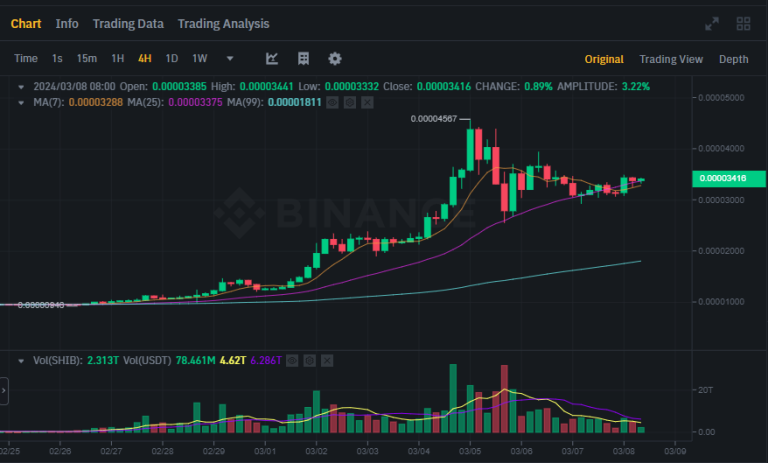
We provided ChatGPT with a chart of the SHIB/USDT trading pair as of 10:40am GMT and asked what it could glean from its trajectory, volumes etc.. This is what it said:
Current Price: The current price of SHIB against USDT is 0.00003416 USDT.
24h Change: In the last 24 hours, the price has changed by +9.38%, indicating an increase in the value of SHIB against USDT.
24h High and Low: The highest price in the last 24 hours was 0.00003497 USDT, and the lowest price was 0.00003047 USDT.
24h Volume: The volume of SHIB traded in the last 24 hours is 27,969,942,334 SHIB, which is equivalent to 911,848,018.04 USDT.
Price Trajectory: The trajectory of the price seems to be generally upward over the displayed period, with the most recent prices being higher than the earlier ones. This upward trend is marked by a series of higher lows, which suggests that Shiba Inu (SHIB) is in an uptrend for the time frame captured in the screenshot. This is supported by the closing prices of the candles being above the moving averages.
Moving Averages: The chart shows two moving averages (MA), which seem to be a 7-day MA (MA7) and a 25-day MA (MA25). The fact that the price is above these moving averages, and that the shorter-term MA (purple line) is above the longer-term MA (green line), generally suggests bullish sentiment in the market. When the shorter MA crosses above the longer MA, it’s often considered a “golden cross,” which is a bullish signal.
Volume: There is a noticeable volume associated with both the upward and the downward movements. However, it seems that there were significant volumes traded during periods of price increase, as evidenced by the green volume bars, which could signify strong buying interest. In contrast, lower volumes are noticed in red volume bars associated with price declines, suggesting less aggressive selling. High volume accompanying the price increase is a positive sign, indicating that the uptrend is supported by a substantial number of transactions.
Consolidation and Breakouts: The price action shows periods of consolidation (where the price moves sideways) followed by upward breakouts. This pattern is typical in bullish phases where the market pauses before continuing its upward momentum. The consolidation phase right before the last price movement could indicate accumulation by traders before pushing the price up.
Support and Resistance Levels: The moving averages and previous price levels might be acting as support (levels where the price tends to stop falling and bounce back up) and resistance (levels where the price tends to stop rising and fall back down). The recent price seems to be above a significant consolidation area, suggesting that a previous resistance level might have been breached, which could now be acting as support.
Market Sentiment: The overall market sentiment seems to be bullish for Shiba Inu in this timeframe, indicated by the positive price change, the price maintaining above the moving averages, and the higher trading volumes on green (up) days. However, it’s important to note that cryptocurrency markets are highly volatile, and sentiment can shift rapidly.
Amplitude: The amplitude (difference between high and low prices within the same time frame) shows some volatility, but not excessive, which could indicate a steady trend with normal fluctuations rather than a highly volatile market.
In summary, the trajectory, volume, and other indicators suggest a bullish market sentiment for Shiba Inu over the displayed time period. However, as with any investment, it’s important to consider other factors such as news, global market conditions, and longer-term trends before making any decisions.


