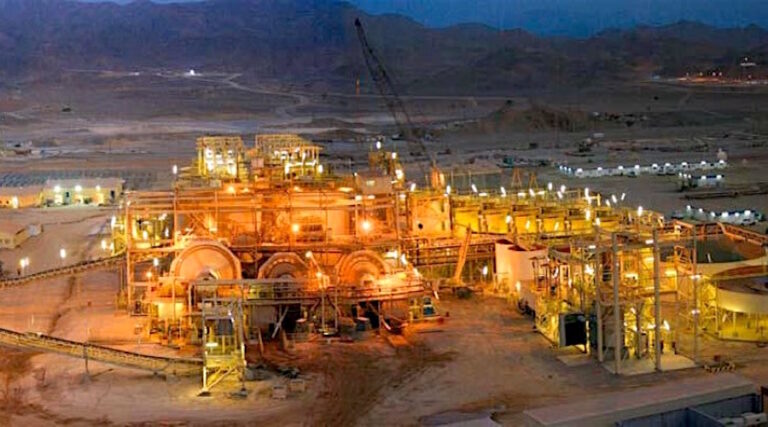
Centamin plc (LON: CEY) today announced unaudited results for the year ended 31 December 2018, annual guidance and proposed final dividend
Josef El-Raghy, Centamin Chairman, commented: “Ten years ago, we produced our first gold bar from Sukari, a seminal milestone in the Company’s history and the Egyptian modern mining industry. Today, we have produced in excess of 3.8Moz of gold from Sukari, with greater than 15 years scheduled future production from this global Tier 1 gold asset.
This year, against an operationally challenging backdrop, Centamin produced 472,418 oz of gold, delivered a solid cost performance and returned excellent exploration results across our portfolio of assets. Our workforce responded to the operational challenges with dexterity and professionalism and, together with a new team in place, are confident in returning Sukari back to its full potential.
We recognise the impact of these short-term challenges on the shareholder experience and would like to take this opportunity to thank you for your support and engagement. Free cash flow generated was US$63.4 million, demonstrating the underlying resilience and financial robustness of the business. The Board of Directors would like to recommend a final dividend of 3.0 US cents (subject to AGM approval), bringing the 2018 total dividend to 5.5 US cents, equivalent to approximately 100% of free cash flow to shareholders.
Financial Highlights(1,2,3,4)
· In accordance with Company dividend policy, proposed final dividend of 3.0 US cents per share (US$34.6 million) bringing 2018 total dividend to 5.5 US cents per share (US$63.5 million); equating to c.100% of free cash flow generated returned to shareholders;
· Revenue of US$603.2 million, an 11% decrease on 2017 (“YoY”), driven by gold sales of 484,322 ounces, a 10% decrease YoY; Average realised gold price of US$1,267 per ounce, largely unchanged YoY;
· Cash costs of production(1,2) of US$289.4 million, a 4% decrease YoY, driven by increase in stockpiles, further reduction in collective stores inventory and improved open pit productivity; collectively offsetting inflationary cost pressures from rising input costs, such as fuel and reagents, and increased consumption, as a result of increased volumes mined and processed;
· Unit cash cost (1,2) increased by 13% YoY to US$624 per ounce produced, in line with reduction in ounces produced;
· All-in sustaining costs (“AISC” (1,2)) of US$420.1 million, largely maintained YoY;
· Unit AISC(1,2) increased 12% YoY to US$884 per ounce sold, in line with reduction in ounces sold;
· EBITDA(1,2,4) of US$257.9 million, a 17% decrease YoY, predominantly driven by reduced volumes of production and increased operating costs;
· Profit before tax(4) of US$152.7 million, a 26% decrease YoY, due to the factors outlined above;
· Royalties of US$18.4 million payable to Arab Republic of Egypt (“ARE”) and profit share of US$76.4 million paid to Egyptian Minerals Resources Authority (“EMRA”), the Company’s government partners;
· Basic earnings per share (2,4) (“EPS”) of 6.5 US cents, a 22% decrease YoY, principally reflecting the scheduled ratchet from a 60:40 ratio to 55:45 (Centamin:EMRA) in the Sukari Gold Mine (“Sukari”) profit share mechanism from July 2018, as detailed under the terms of the Concession Agreement, and reduced production;
· Operational cash flow of US$223.4 million, a 34% decrease YoY, due to the factors mentioned above and a 7% increase in mine production costs driven by increased volumes of material moved;
· Free cash flow(1) generated of US$63.4 million in 2018, down 56% YoY, due to reduced volume produced and scheduled change in profit share economics;
· Cash and liquid assets(1,3) of US$322.3 million, at 31 December 2018, after distribution of the interim dividend of US$28.9 million (2.5 US cents per share) on 28 September 2018; and
· The Company remains debt-free and unhedged.
· The consolidated financial information for the year ended 31 December 2018 was approved for issue by the Board of directors of the Company on 25 February 2019. The consolidated financial information is unaudited but is derived from the Group’s full financial accounts, which are in the final stages of being audited.
|
Year ended 31 Dec |
|
|
|
|
Year ended 31 Dec |
|
|||
|
|
units |
2018 |
Q4 2018 |
Q3 2018 |
Q2 2018 |
Q1 2018 |
2017 |
Q4 2017 |
|
|
Gold produced |
oz |
472,418 |
137,600 |
117,720 |
92,803 |
124,296 |
544,658 |
154,298 |
|
|
Gold sold |
oz |
484,322 |
148,851 |
106,798 |
97,628 |
131,045 |
539,726 |
153,490 |
|
|
Cash cost of production (1,2) |
US$’000 |
289,394 |
82,579 |
70,874 |
64,630 |
71,312 |
301,706 |
69,965 |
|
|
Unit cash cost of production |
US$/oz produced |
624 |
609 |
619 |
714 |
581 |
554 |
453 |
|
|
AISC (1,2) |
US$’000 |
420,116 |
118,911 |
92,056 |
102,211 |
106,939 |
426,466 |
114,247 |
|
|
Unit AISC (1,2) |
US$/oz sold |
884 |
809 |
889 |
1,073 |
825 |
790 |
744 |
|
|
Average realised gold price |
US$/oz |
1,267 |
1,235 |
1,206 |
1,298 |
1,328 |
1,261 |
1,278 |
|
|
Revenue |
US$’000 |
603,248 |
181,730 |
125,127 |
123,929 |
172,462 |
675,510 |
190,413 |
|
|
EBITDA (1,2) |
US$’000 |
257,934 |
79,460 |
48,746 |
45,774 |
83,954 |
309,197 |
99,298 |
|
|
Profit before tax(4) |
US$’000 |
152,702 |
50,490 |
21,836 |
21,977 |
58,399 |
207,365 |
77,348 |
|
|
Basic EPS (2) (4) |
US cents |
6.50 |
1.69 |
0.93 |
1.32 |
2.56 |
8.38 |
3.78 |
|
|
Sustaining capex incl. Sukari exploration(4) |
US$’000 |
96,779.0 |
21,090 |
21,812 |
28,798 |
25,079 |
87,167 |
28,421 |
|
|
Operating cash flow(4) |
US$’000 |
223,404 |
73,439 |
27,303 |
37,247 |
85,415 |
337,093 |
106,566 |
|
|
Free cash flow (1) (4) |
US$’000 |
63,429 |
28,652 |
(1,298) |
1,594 |
34,481 |
145,551 |
49,060 |
|
Operational Highlights(1,2)
· Group Lost Time Injury Frequency Rate (“LTIFR”) of 0.06 per 200,000 workplace hours, a 76% reduction YoY, with two lost-time injuries, a reflection of our ongoing focus and commitment on health and safety;
· Sukari Gold Mine (“Sukari”) produced 472,418 ounces, a 13% reduction YoY;
· Record open pit material movement of 77.9Mt, an 10% increase YoY, including record open pit ore mined of 23.1Mt, a 44% increase YoY, as mining of the Stage 4 transitional zone was completed and progressed into the higher-grade sulphide material, the predominant source of ore from the open pit for the next three years;
· Open pit average milled grade was 0.76g/t, a 15% decrease YoY;
· The run of mine (“ROM”) ore stockpile increased from 2.18Mt (at 0.51 g/t) at 31 December 2017, to 12.22Mt (at 0.47g/t) at 31 December 2018, with 7.7Mt at 0.44g/t now classified as longer term stockpiles and including 1.6Mt at 0.37g/t expensed due to the change in stockpiles cut-off grade;
· Total underground ore mining of 1.24Mt, a 9% increase YoY, at an average mined grade of 5.69g/t, a 31% decrease YoY due to increased dilution from the cascading stopes in the Amun zone and increased tonnes of lower grade development ore;
· Cleopatra decline development completed 2,260 metres, delivering 185,333 tonnes of ore at an average mined grade of 1.74g/t, resulting in 8,959 ounces produced;
· The second long-hole drill rig (“LHDR”) is on site and commissioned; and
· Plant throughput of 12.6Mt, a 4% increase YoY, at a head grade of 1.26g/t, a 20% decrease YoY.
2019 Outlook(7)
· Gold production guidance of 490,000 – 520,000 ounces for 2019, with increased stripping in the open pit balanced by estimated higher average grades.
· Cash cost of production in 2019 are expected to be between US$675-US$725 per ounce produced and AISC between US$890-US$950 per ounce sold.
· Increase in forecast costs account for increased volumes scheduled to be mined from the open pit, including stripping for Stage 5. Going forward costs will benefit from existing and new cost optimisation initiatives, including the construction of a 40MW (AC) solar plant for which the feasibility design study is being prepared for Board approval.
· Open pit mining will continue predominantly in Stage 4, with grades improving towards the reserve grade throughout the first half (“H1”), with waste stripping to commence on Stage 5. Stripping ratio is expected to increase to 5.85:1.
· Underground mining is focussed in the lower Amun/Osiris flats and Ptah zone. A split of 75:25 stoping to development is expected.
· Guidance provided is annual. The mine plan schedules a progressive quarter on quarter performance, with the underground contribution largely consistent, and the open pit increasing as the grade improves with depth. The first quarter (“Q1”) is scheduled to be 105-115koz accounting for increased movement of waste material from Stage 4 and 5.
· Underground decline development scheduled to progress at the Cleopatra decline and Amun/Ptah decline, preparing access to future stoping and further exploration access to Bast and Top of Horus, supporting near and long-term growth upside.
· Capital expenditure of US$118 million, of which US$89.2 million is sustaining capital investment, including ongoing underground development and phased fleet rebuild programme. Capital expenditure for the solar farm and new TSF, remain subject to board approval, and therefore have not been included in published cost estimates.
· Following the exploration success of 2018, the Group exploration budget (sustaining and non-sustaining spend) of US$40 million is targeting reserve and resource expansion at Sukari underground, Doropo Project and ABC Project, while identifying new scalable targets for future exploration and growth upside.
1 2019 guidance is based on the following assumptions: average gold price of US$1,250/oz; Average oil price of diesel fuel oil at US$0.60/litre.
Exploration Highlights(4)
In 2018, the intensive exploration programme across the portfolio of assets, including a total 150,000 metres of drilling, delivered excellent results.
Group Mineral Resource and Reserve Update(5)
· The Group consolidated mineral resource has grown to 15.7Moz measured and indicated, a 5% increase on 2017 statements.
· Sukari measured and indicated mineral resource of 11.0Moz at 1.07g/t gold, a 6% decrease in contained metal and a 4% increase in grade, driven predominantly by mining depletion.
· Sukari proven and probable mineral reserves of 7.25Moz proven and probable, a 9% decrease, driven by mine depletion and increased cut-off, adjusting for higher input costs.
· Sukari open pit proven and probable reserves of 6.2Moz at 1.1g/t gold, underpinning greater than 15 years of sustainable production at current mining rates.
· Sukari underground:
o Successfully replaced reserves in excess of mining depletion and increased reserve grade by 11%: 4.4Mt at 5.6g/t gold for 0.8Moz of proven and probable reserves;
o 14% increase in measured and indicated resources, driven by 9% increase in tonnes and 5% increase in grade: 8.1Mt at 7.1g/t gold for 1.85Moz of measured and indicated resources; and
o 40% conversion to highest confidence category: 2.8Mt at 8.3g/t gold, for 0.77Moz of Measured resources, driven by a 47% increase in tonnes and a 6% decrease in grade.
· Doropo Project (as previously announced) mineral resource of 2.13Moz indicated and 0.8Moz inferred, a 58% increase in indicated ounces, driven by a 55% increase in resource tonnes to 50Mt at 1.31 g/t gold.
· ABC Project maiden mineral resource of 19.6Mt at 1.03 g/t gold for 650koz indicated, and 450koz inferred resource.


