Centamin PLC (LON:CEY) today announced Q1 2019 results for the three months ended 31 March 2019.
HIGHLIGHTS
Operational
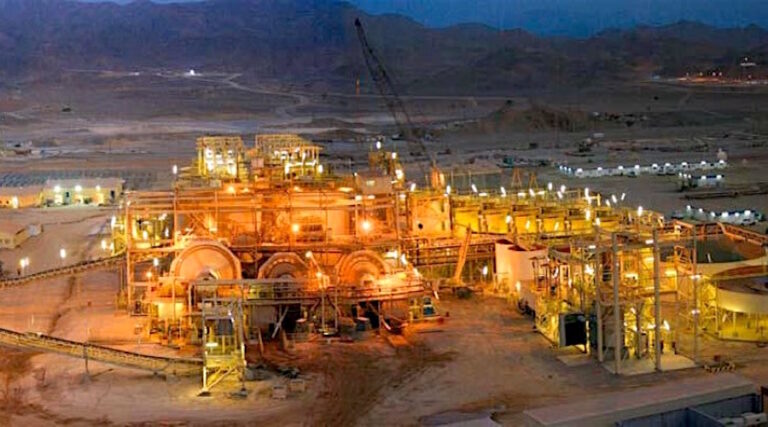
· Sukari Gold Mine (“Sukari”) produced 116,183 ounces of gold in the first quarter (“Q1”), above forecast of 105,000 – 115,000 ounces.
· Ongoing operational improvements delivered in the open pit and underground.
· Record processing plant throughput of 3.25Mt of ore at a 95% plant utilisation rate.
· Both unit cash costs and all in sustaining costs (“AISC”) trending toward the lower end of annual guidance; cash costs of production of US$631 per ounce produced and AISC of US$898 per ounce sold.
Exploration
· Successful drilling campaign at Sukari continues to unlock more reserve and resource growth potential, identifying ore suitable for near- and medium-term production; Encouraging results from the Horus Deeps confirmed mineralisation remains open at-depth and along strike.
· Doropo Project resource update, increasing Indicated resource estimate by 58% to 2.13Moz Indicated and 0.8Moz Inferred with further positive results confirming structural extensions and resource upside.
· Maiden resource estimate at ABC Project of 650koz Indicated and 450koz Inferred.
Environmental, Social and Governance
· Good progress with succession planning and recruitment initiatives with the appointment of Dr Sally Eyre as Independent Non-Executive Director, Jeremy Langford as Chief Operating Officer (“COO”), as well as several high calibre individuals into key operational roles of Operations Director, Underground Manager, Technical Services and Planning Manager, and Supply Chain Manager.
· Group Lost Time Injury Frequency Rate (“LTIFR”) of 0.60 per 200,000 workplace hours.
Financial
· Generated US$13.9 million of Group free cash flow (1), net of profit share payments to the Egyptian government and investing activities.
· Strong and flexible balance sheet with no debt, no hedging and cash and liquid assets(4) of US$331.6 million, as at 31 March 2019.
· 2018 final dividend approved at the Annual General Meeting, with US$34.6 million (3.0 US cents per share) to be paid to shareholders on 13 May 2019(5).
Outlook
· The Company is on track and reiterates annual guidance for 2019: gold production of 490,000 – 520,000 ounces, at cash costs of US$675-725 per ounce produced and an AISC of US$890-950 per ounce sold.
· Continued exploration focus with 2019 budget of US$40 million targeting Cleopatra exploration and decline development, reserve and resource expansion at Sukari underground, Doropo Project and ABC Project, while identifying new scalable targets for future exploration and growth upside.
· Updated resource, maiden reserve and Preliminary Economic Assessment (“PEA”) for the Doropo Project to be completed by the end of H2 2019.
· Completion of 40MW (AC) solar power plant feasibility study at Sukari during H2 2019, with the scope to significantly reduce power costs and reliance on fossil fuels.
· Delivering on the Board succession programme to identify and appoint three Non-Executive Directors with one migrating to Non-Executive Chair.
· The Company will release 3-year outlook, including 2020 and 2021 guidance, in Q2 2019.
Andrew Pardey, CEO, commented:
“We have made a solid start, delivering Q1 ahead of expectations. Despite being the weakest quarter forecasted for 2019, it is encouraging to see the systems and process upgrades across all sections of the mine positively impacting performance. The Company is on track to deliver annual production and cost guidance for 2019. The focus remains firmly on delivering continued operational progress through tight compliance to plan.
A stronger second half for the year is forecast, delivering approximately 55% of the annual production guidance during H2 2019. This will be driven by increasing quarter on quarter open pit ounce contribution, as the grade profile improves with depth, and further optimisation of our underground operations.
We are delighted to have welcomed so many top-tier technical individuals to the Company, including Dr Sally Eyre as a Non-Executive Director and Jeremy Langford as Chief Operating Officer. Their experience will be instrumental in maximising the value of the Company’s asset base.
Centamin’s clear corporate strategy, technical expertise, highly prospective asset base and robust balance sheet provide the solid foundation to generate sustainable cash flow, drive organic growth and maximise shareholder returns.”
Table 1. Q1 2019 Group Production Summary
|
Quarter on quarter comparative |
Year on year comparative |
||||||||
|
units |
Q1 2019 |
Q4 2018 |
% change |
Q1 2018 |
% change |
||||
|
Open pit |
|
|
|
|
|
|
|
||
|
Total material mined |
kt |
20,987 |
21,075 |
(0.4%) |
|
18,496 |
15% |
||
|
Ore mined |
kt |
3,126 |
4,990 |
(37%) |
|
6,047 |
(48%) |
||
|
Ore grade mined |
g/t Au |
0.72 |
0.75 |
(4%) |
|
0.50 |
44% |
||
|
Strip ratio |
waste/ore |
5.71 |
3.22 |
77% |
2.06 |
178% |
|||
|
Underground |
|
|
|
|
|
|
|||
|
Ore mined |
kt |
270 |
314 |
(14%) |
|
312 |
(14%) |
||
|
Ore grade mined |
g/t Au |
6.34 |
6.21 |
2% |
6.69 |
(5%) |
|||
|
Processing |
|
|
|
|
|
|
|
||
|
Ore processed |
kt |
3,248 |
3,198 |
2% |
|
3,068 |
6% |
||
|
Feed grade |
g/t Au |
1.28 |
1.45 |
(11%) |
|
1.31 |
(2%) |
||
|
Gold recovery |
% |
88.8 |
89.1 |
(0.3%) |
|
89.6 |
(0.9%) |
||
|
Total gold production |
oz |
116,183 |
137,600 |
(16%) |
|
124,296 |
(7%) |
||
|
Gold sold |
oz |
111,365 |
148,851 |
(25%) |
131,045 |
(15%) |
|||
|
Cash costs of production(1,2) |
US$’000 produced |
71,892 |
82,579 |
(13%) |
|
71,312 |
1% |
||
|
Cash costs of production(1,2) |
US$’000 sold |
71,471 |
96,743 |
(26%) |
|
78,126 |
(9%) |
||
|
All-in sustaining costs (“AISC”)(1,2) |
US$’000 sold |
98,041 |
118,911 |
(18%) |
|
106,939 |
(8%) |
||
|
Unit cash costs(1,2) |
US$/oz produced |
631 |
609 |
4% |
|
581 |
9% |
||
|
Unit cash costs(1,2) |
US$/oz sold |
655 |
658 |
(1%) |
|
603 |
9% |
||
|
Unit AISC(1,2) |
US$/oz sold |
898 |
809 |
11% |
825 |
9% |
|||
|
Average realised sales price |
US$/oz |
1,303 |
1,235 |
5% |
1,328 |
(2%) |
|||
________________________________________________________________________________________________
(1) Cash cost of production, AISC, and cash, bullion on hand, gold sales receivables, and free cash flow are non-GAAP measures, based on unaudited accounts.
(2) Cash cost of production and AISC reflect a provision against prepayments to reflect the removal of fuel subsidies which occurred in January 2012. Further details can be found in the Company 2018 Annual Report – refer to note 2.7 of the financial information for further details).
(3) Profit share commenced during the third quarter of 2016. The first two years was a 60:40 split of net production surplus to PGM and EMRA respectively. From 1 July 2018 this changed to a 55:45 split for the next two-year period until 30 June 2020, after which all net production surpluses will be split 50:50.
(4) Cash and cash equivalents, bullion on hand, gold sales receivables and financial assets at fair value through other comprehensive income.
(5) Full details on the Company’s dividend policy, including the 2018 Final Dividend timetable, can be found on the website athttps://www.centamin.com/investors/shareholder-services/dividend-information


